Dice Probability
Probability of Totals on Two Six-Sided Dice
Ravid Rahman
October 30th, 2018
Abstract
This experiment shows that the most frequent total for two six-sided dice is seven. Besides this, the experiment reveals a relation with the possible combinations of rolls for a given total and its frequency. For simplicity, “two six-sided dice” is referred to as “2d6” and “six-sided dice” as “d6.”
Introduction
What is the most frequent total on a roll of two six-sided dice? The following experiment looks to identify just that. The total that is expected to occur most frequently is seven. This is, however, a widely discussed topic. Other works regarding this are Singh’s The Probability Distribution of the Sum of Several Dice: Slot Applications and Lukac’s Investigation of probability distributions using dice rolling simulation. Singh and Lukac take very different approaches to demonstrate the same findings. Singh uses formulas to “…obtain the probability distribution of [2d6]” (Singh, 3) Lukac, on the other hand uses a similar method to determine his results, however he does so for three d6. The results of all of the experiments do yield the same result: a certain number is more frequent because “…there are more possibilities for the sum…(Lukac, 9).”
Materials
- 2d6, preferably distinct
- Utensils for note-taking (excel, pen/paper, etc.)
- A flat surface to ensure dice rolls appropriately
Methods
- Roll both d6 at once.
- Take note of the roll of each die.
- Sum and make a note of the total of the roll.
- Repeat steps 1 through 3 until there are 100 total rolls.
- Tally each different total (e.g. the number of fives, sixes, sevens, etc.).
Results
Charts/Tables
| Total | Frequency |
| 2 | 3 |
| 3 | 4 |
| 4 | 10 |
| 5 | 13 |
| 6 | 14 |
| 7 | 20 |
| 8 | 16 |
| 9 | 10 |
| 10 | 4 |
| 11 | 3 |
| 12 | 3 |
See Appendix A for complete data sheet.
Graphs
Summary
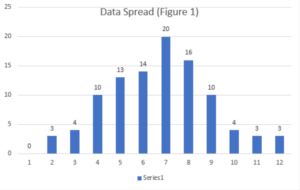
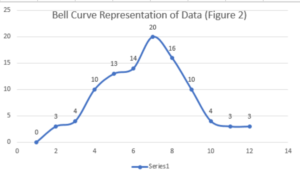
Glancing at Appendix A shows the breakdown of each roll used for this experiment. The chart above is a tally of each total from Appendix A. Figure 1 and Figure 2 are graphical representations of these tallies. Figure 1 is a simple graphical representation of the tally, whereas Figure 2 shows us the trend of the totals.
Analysis
Observations
Looking at Figure 1, it is apparent that seven is the most frequent roll (which supports the hypothesis). Figure 1 does however hint at something more interesting about the nature of the totals. This is better echoed in Figure 2 where we can see a bell curve. This tells us that totals are less frequent as they approach either the smallest possible rolls, or the largest possible rolls. However, it is not coincidence that the total with the highest frequency is the total that falls half way between the two extrema. This is because the total of seven is comprised of the most individual rolls, as echoed in Lukac’s paper, as well as Singh’s paper even though he proves this mathematically instead of practically.
Errors and Improvements
The main source of errors for this experiment are computational as one is likely to let a simple error slip past themselves as one goes through the large quantity of rolls. This can be fixed by implementing a program to count the data and report relevant calculations. Another improvement would be to increase the volume of rolls, as that would yield in a smoother bell curve, thus providing clearer data for better analysis.
Applications
The findings of this experiment can be used to better design random number generators, as it shows that generators that use multiple pools to accumulate one digit are unreliable as they will have a propensity to result in a certain output. For example, in our case, it would be more random to roll one d6 than 2d6 since 2d6 are more likely to yield a total of 7, whereas one d6 has equal chance for any of the six rolls. This logical can also be applied to gambling games that involve 2 or more dice. The results of the experiment show that it is always safer to bet on certain numbers. For example, in a game using 2d6 it would be safer to bet on a seven being the total since, even though the other numbers will appear, it is more likely for the total to be seven.
References
Lukac, S., & Engel, R. (2010). Investigation of probability distributions using dice rolling
simulation. Australian Mathematics Teacher, 66(2), 30–35. Retrieved from http://ccny-proxy1.libr.ccny.cuny.edu/login?url=https://search.ebscohost.com/login.aspx?direct=true&db=a9h&AN=51533174&site=ehost-live
Singh, A. K., Dalpatadu, R. J., & Lucas, A. F. (2011). The Probability Distribution of the Sum of
Several Dice: Slot Applications. UNLV Gaming Research & Review Journal, 15(2), 109–118. Retrieved from http://ccny-proxy1.libr.ccny.cuny.edu/login?url=https://search.ebscohost.com/login.aspx?direct=true&db=a9h&AN=69735833&site=ehost-live
Appendix A
Appendix A: Table of rolls and totals
| Roll 1 | Roll 2 | Total |
| 1 | 1 | 2 |
| 6 | 2 | 8 |
| 3 | 6 | 9 |
| 3 | 5 | 8 |
| 4 | 4 | 8 |
| 4 | 3 | 7 |
| 2 | 6 | 8 |
| 6 | 1 | 7 |
| 4 | 6 | 10 |
| 1 | 6 | 7 |
| 1 | 1 | 2 |
| 5 | 2 | 7 |
| 3 | 4 | 7 |
| 3 | 4 | 7 |
| 2 | 3 | 5 |
| 1 | 4 | 5 |
| 4 | 5 | 9 |
| 1 | 3 | 4 |
| 5 | 6 | 11 |
| 1 | 6 | 7 |
| 2 | 1 | 3 |
| 3 | 3 | 6 |
| 4 | 2 | 6 |
| 1 | 3 | 4 |
| 3 | 3 | 6 |
| 6 | 1 | 7 |
| 6 | 1 | 7 |
| 5 | 4 | 9 |
| 3 | 5 | 8 |
| 5 | 3 | 8 |
| 1 | 4 | 5 |
| 2 | 5 | 7 |
| 4 | 2 | 6 |
| 4 | 3 | 7 |
| 1 | 6 | 7 |
| 1 | 5 | 6 |
| 5 | 2 | 7 |
| 3 | 5 | 8 |
| 3 | 1 | 4 |
| 3 | 6 | 9 |
| 5 | 5 | 10 |
| 6 | 1 | 7 |
| 6 | 2 | 8 |
| 4 | 1 | 5 |
| 3 | 2 | 5 |
| 4 | 1 | 5 |
| 2 | 3 | 5 |
| 4 | 1 | 5 |
| 6 | 5 | 11 |
| 6 | 4 | 10 |
| 3 | 2 | 5 |
| 1 | 4 | 5 |
| 2 | 6 | 8 |
| 2 | 2 | 4 |
| 6 | 6 | 12 |
| 2 | 3 | 5 |
| 2 | 2 | 4 |
| 6 | 5 | 11 |
| 3 | 3 | 6 |
| 3 | 6 | 9 |
| 2 | 5 | 7 |
| 3 | 6 | 9 |
| 5 | 3 | 8 |
| 3 | 4 | 7 |
| 2 | 6 | 8 |
| 2 | 2 | 4 |
| 4 | 2 | 6 |
| 3 | 6 | 9 |
| 1 | 2 | 3 |
| 3 | 3 | 6 |
| 3 | 1 | 4 |
| 2 | 4 | 6 |
| 4 | 6 | 10 |
| 2 | 4 | 6 |
| 2 | 2 | 4 |
| 4 | 4 | 8 |
| 2 | 2 | 4 |
| 1 | 5 | 6 |
| 6 | 6 | 12 |
| 5 | 3 | 8 |
| 2 | 5 | 7 |
| 5 | 3 | 8 |
| 3 | 5 | 8 |
| 3 | 4 | 7 |
| 1 | 6 | 7 |
| 1 | 3 | 4 |
| 2 | 1 | 3 |
| 5 | 1 | 6 |
| 1 | 1 | 2 |
| 4 | 1 | 5 |
| 2 | 3 | 5 |
| 5 | 3 | 8 |
| 3 | 6 | 9 |
| 5 | 4 | 9 |
| 1 | 5 | 6 |
| 5 | 4 | 9 |
| 2 | 4 | 6 |
| 6 | 6 | 12 |
| 3 | 4 | 7 |
| 1 | 2 | 3 |

This entry is licensed under a Creative Commons Attribution-NonCommercial-ShareAlike 4.0 International license.